Advanced analytics tools, such as Google Analytics, enable business owners to precisely track the effects of their online activities. However, having access to the plethora of data is one thing while being able to zero in on the key metrics, correctly interpret them and clearly explain the insights to colleagues and business partners is an altogether different story. If you also feel overwhelmed by the sheer variety of analytics data or just need a simple way of separating the crucial metrics from the unnecessary ones, Google Data Studio (GDS) is here to make your life easier. Read on to find out what this tool does and why we find it so extremely useful.
Google Data Studio: When Analytics Finally Makes Sense
Your Data: Beautifully Visualised
Clear and, above all, reliable insights into the online presence of a particular business (be it a corporate website, advertising or social media activities) are key to any successful digital strategy. They are vital for us, digital marketing specialists, to be able to guide our clients toward better results, as well as business owners, who need a way of tracking the effects of their online activities. While easily understandable analytics data are especially important for small businesses at the beginning of their online journey, they are also indispensable for experts who need to present the results of their work in the simplest possible way.
And this is where Google Data Studio really excels, offering anyone – regardless of their analytics experience or digital marketing skills, a simple overview of how successful their various online activities are.
For at its core, Google Data Studio is a data visualisation tool that can bring together analytic insights from several different sources. What exactly does this mean? That you can use it to turn the most important data on the performance of your website and the related online channels into simple and completely personalised, easy-to-understand and visually attractive reports. Let’s take a closer look at its most exciting capabilities!
Focus on what Actually Matters
Every business has different online tricks up its sleeve and therefore needs to track a different set of analytics data. And one of the main advantages of a Google Data Studio report is its customizability. One can create visually stunning interactive dashboards which only contain the metrics that are the most relevant to their business – without any additional clutter that would take the focus away from the most important insights!
Everything in one Place
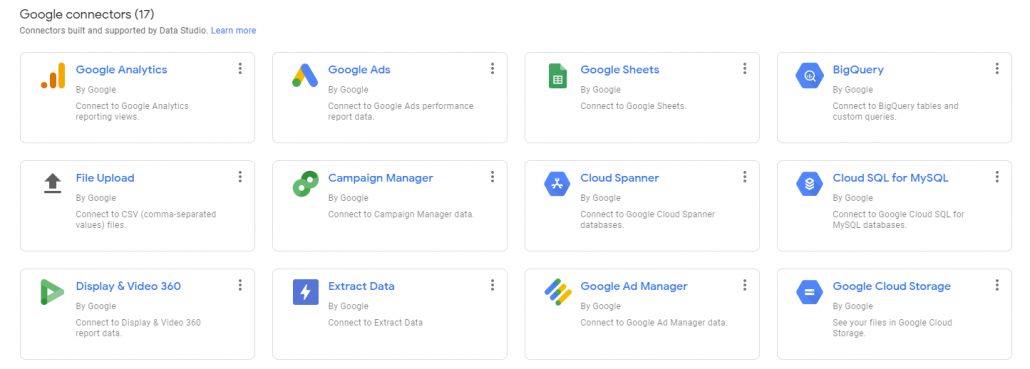
And as we’ve already mentioned: the report can contain analytics data from several different sources. This means that you get to decide which analytics tools and other data sources you want to base your report upon, using simple plugins to connect Google Data Studio to their databases. A GDS report can include the data from a wide variety of online tools and platforms. To name but only a few of the most popular ones:
- Google’s own analytics and advertising toolkit: Google Analytics, Google Ads
- SEO tools: SEMrush, Ahrefs
- Facebook and its advertising tools: Facebook Business Manager, IF in IG insights
- Data from other social media platforms: LinkedIn, Twitter
- Custom databases
At the moment, Google Data Studio can connect to 200 different data sources (you can find a complete list here). Additionally, there are several third party plugins available, such as Supermetrics, to access sources that don’t have their own plugin (Facebook, LinkedIn Ads, Instagram, SEMrush, Amazon, Adobe Analytics, Hubspot, Shopify …).
This means that you can track all the metrics that you rely on to measure your online success with the help of just one clearly structured and beautiful report, which makes the analysis quick and super easy. This way, you won’t lose precious time by checking every single tool and database individually.
Colourful is Clear
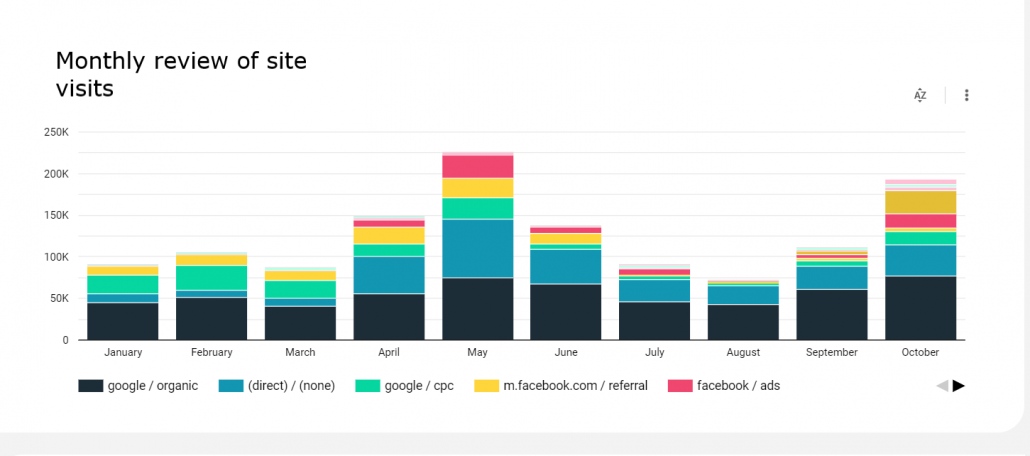
Numbers will tell you a much clearer story if you turn them into wonderful graphs, pie or funnel charts and tables. Well-designed and colourful presentations, which can be completely personalised to suit your corporate identity, provide order and clarity. Thus, even those that have just entered the digital marketing arena can easily make their first analytics steps and understand how successfully they represent their business online.
Information in Real Time, Accessible from Anywhere
Google Data Studio enables reporting in real time, which means the data in the report are always fresh. Moreover, you can use filters to focus on a certain time window or compare the data for different periods.
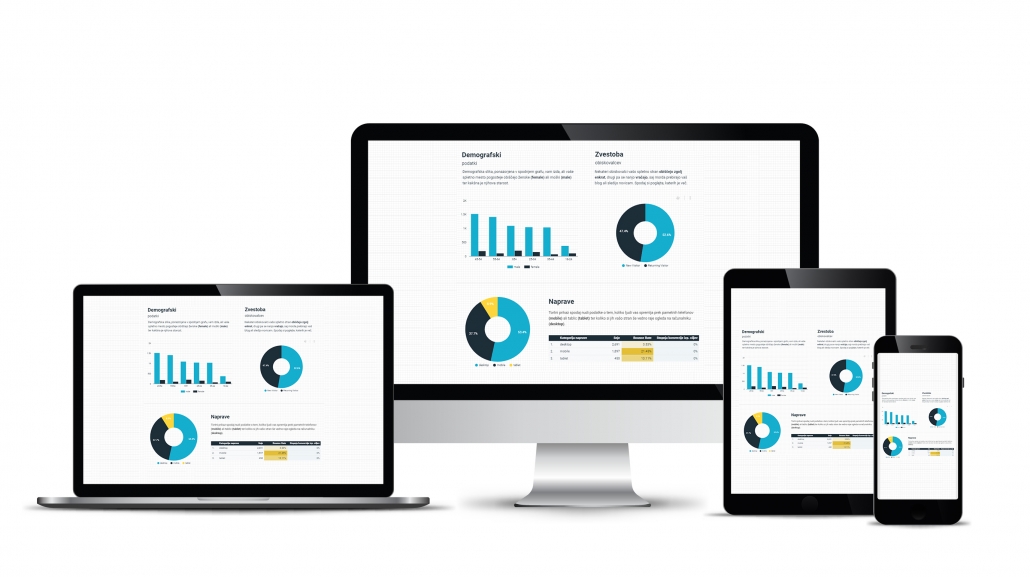
What is more, you can access a GDS report from any device – as long as you have the appropriate username and password. It also takes only a few clicks to share the report or dashboard with coworkers, partners or clients.
Just what You Need!
It doesn’t really matter if you’ve just dipped your toes into web analytics or consider yourself a digital marketing veteran – with Google Data Studio, you will always be one step closer to new business victories. In this chapter, we explain how a cleverly designed GDS report can be best utilised by different groups or types of users. We believe there’s a high chance you also belong to one of them!
- Just starting your business journey? Why not use a little boost?
The first steps are always the hardest, but Google Data Studio can provide a shortcut to your first business results. With the help of a GDS report, you will never get lost in a sea of metrics, instead immediately prioritising the data that are crucial for your first stages. A simple and clear interface will also help you understand the basics of analytics faster.
- Want to weed out unnecessary data?
Are you tired of digging deep into the analytics, scanning through countless menus of SEO tools or switching between several browser tabs? If you are looking to step up your online game but lack the time to really immerse yourself into the metrics, use Google Data Studio to save time and still keep track of key business data needed to make informed decisions. And what is more: you’ll only focus on metrics that really matter, which will also help you also make your priorities and future goals much clearer.
- Impress your Superiors …
How do you convince the management that the latest Facebook campaign has proven to be more successful than the one before it, make your superiors agree on a higher SEO budget or provide clear arguments for the recent website overhaul? Digital marketing specialists often struggle to present the results of their work to their superiors – at least clearly and for everyone to understand. When using colorful charts in a GDS report to make numbers really come to life, even managers who have no experience in analytics will understand the past results and the current online needs of their business.
- … or your clients
How does a digital expert keep their clients posted about what is going to their new corporate website, how successful the new ad campaigns are or whether the latest social posts have already had any effect? Especially if you work with many traditionally oriented businesses that have little experience in the digital world, using Google Data Studio is an efficient way of helping your clients really notice and appreciate the results of your work. Providing them with an easy and transparent report will also help you win their trust!
Custom report
While Google Data Studio is completely free and anyone can use it, configuring a report on your own requires quite a few analytics skills and a fair bit of knowledge. In order for the report to really show the latest data and for this data to also be correct, one also needs to properly configure the tools that the GDS report will be based upon.
If analytics isn’t your strong point, it is therefore advisable to leave the configuration to experienced professionals. The last thing you want is to develop your online business strategy with the help of the wrong data, especially after losing numerous hours and tons of energy to get used to all the options and settings that Google Data studio enables.
Want to find out more about what it takes to create a GDS report and how Optiweb’s own specialists tackle this challenge? Then don’t forget to follow our blog! In our next article, we’ll tell you everything about how our experts can also team up with you, configuring a unique report that is completely tailored to your business needs as well as your company identity..
However, if you want to take advantage of a clearly structured, easy to read and visually attractive GDS report right now, don’t hesitate to get in touch!
Having already helped big brands as well as smaller and niche businesses stay on top of their reporting activities, our analytics experts have rich experience in the configuration of Google Data Studio dashboards and reports; they will be more than happy to also take care of your business intelligence and help you achieve the great results you deserve!

